


One of the areas we are watching closely is the national debt. This Market Watch gives a high level overview of the national debt situation.
How does the U.S. government accumulate debt?
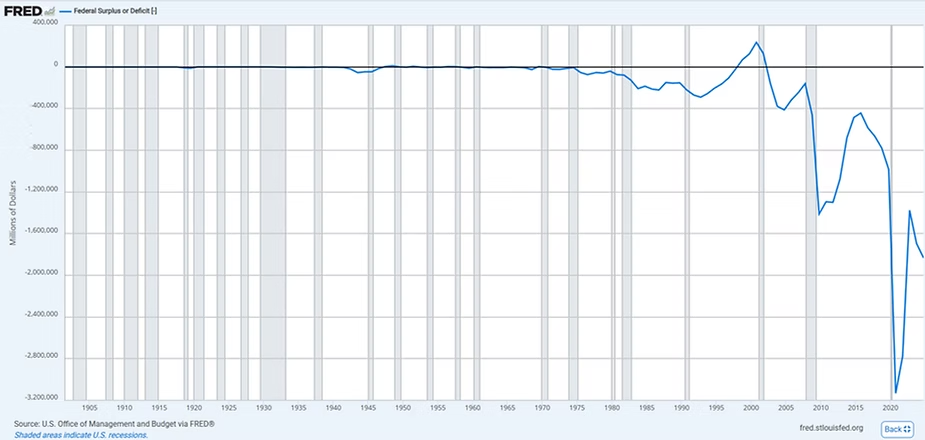
The national debt increases when the government spends more than it collects in revenue (i.e., a government budget deficit).
When was the last time the U.S. government had a budget surplus?
2001 was the last time the government had a budget surplus. The way to read the following chart is that when the blue line is below the black line, there is a deficit. And when it is above, there is a surplus. The gray shaded bars indicate recession periods.
Has the U.S. ever been debt free?
Only in 1835 under President Andrew Jackson. President Jackson had a reputation for disliking debt and made it a priority to eliminate it. He vetoed the re-charter of the national bank, vetoed spending bills, put an end to infrastructure projects, and sold vast amounts of government land in the West. However, being debt-free as a country was not perfect. Selling the federal land led to a real estate bubble, and not having a national bank resulted in little regulation over reckless consumer spending and borrowing. These factors were among many that contributed to the Panic of 1837 (History.com).
How much debt does the U.S. have?
$36.2 Trillion. The United States has the most national debt in the world in absolute terms. Debt-to-GDP is a commonly used measure to compare the size of a country’s debt to their economic output.
You can see from the chart below that debt-to-GDP increased at an abnormally fast rate during 2008-2009 and Covid. National debt increased to finance the fiscal and monetary stimulus. Couple that with decreasing GDP during those years and it results in rapid growth of the debt-to-GDP ratio. 2020 shows what happens when monetary and fiscal policy work hand in hand. It was needed to stem the uncertainty of Covid. We can tackle the debt if we work both monetary and fiscal policy for the benefit of the U.S. citizens.
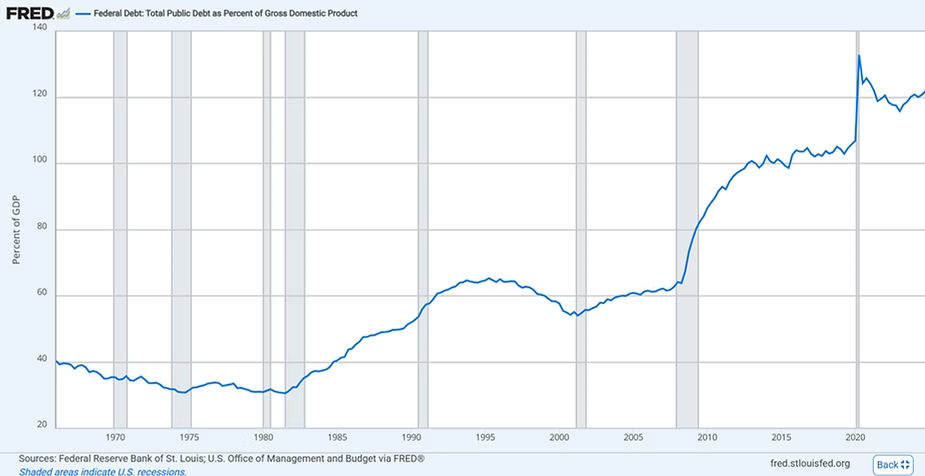
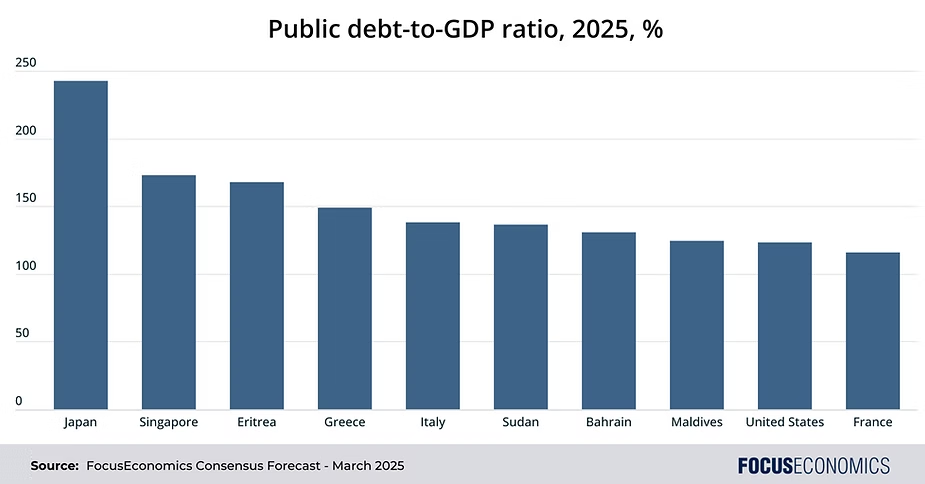
Japan has the highest debt-to-GDP ratio in the world at nearly 250%. The United States has been sitting around 124%. However, comparing U.S. debt to Japan is not an apples-to-apples comparison. Japan has demographic issues with an aging population, which puts downward pressure on productivity and upward pressure on social security expenses. They also underwent decades of low to negative interest rates and quantitative easing to address deflation and their struggling economy.
Who owns the U.S. debt?
About 20% of the debt is considered to be intra-governmental. This is comprised of 13% attributed to the Federal Reserve and 7% to Social Security and other government agencies. Nearly 25% of the debt is owned by foreigners. And the other 55% is owned domestically by U.S. investors (Q3 2024, Reuters, Federal Reserve Bank of St. Louis).
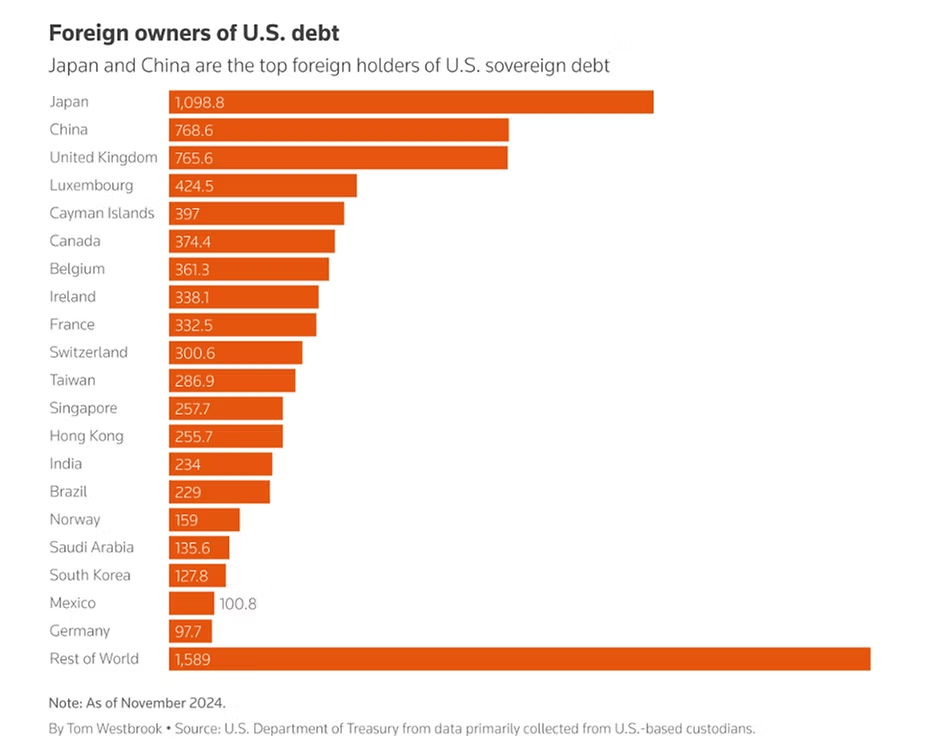
China, Japan, and the United Kingdom are the top 3 foreign holders of U.S. government debt. Luxembourg and the Cayman Islands are also high on the list due to both being major international finance centers.
How can the U.S. address its debt?
The answer is simple, yet complicated. To start addressing the debt, the government would need to make more than it spends, thereby running a consistent budget surplus. This can be done by reducing expenses or increasing their revenue.
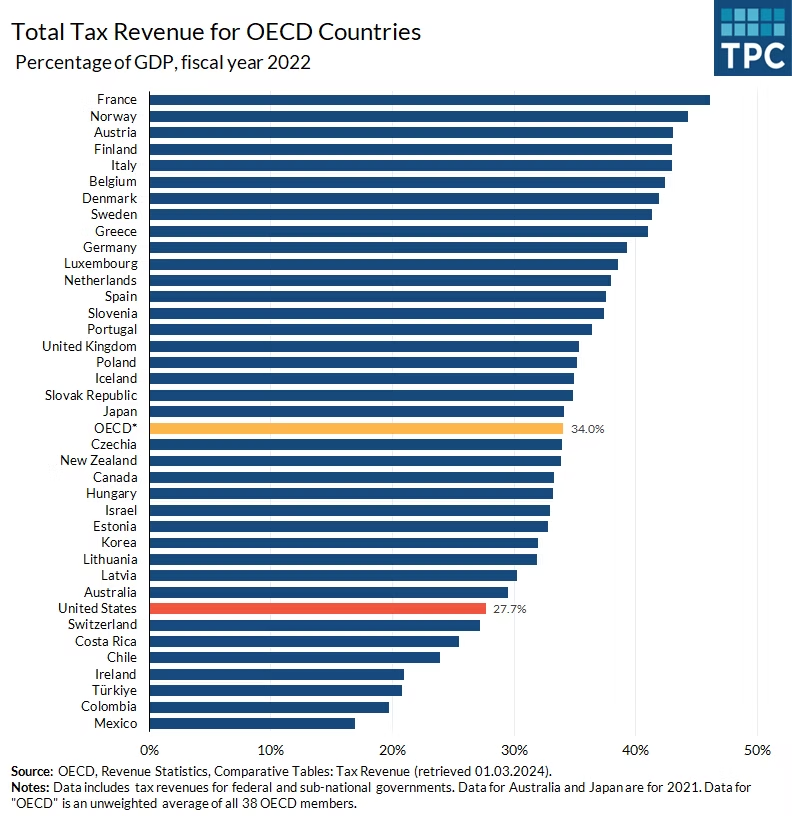
The main source of government revenue is taxes. As individuals, do we want taxes to increase? No, absolutely not. As students of the economy, do we suspect taxes will need to increase? Yes. Unless both parties consistently over time cooperate on expense management, then revenue will be the mechanism used to address the debt. The following chart shows tax revenue relative to GDP for various countries around the world for 2022.
We agree with the school of thought that growing the economy can shrink government debt faster, mainly by cutting the debt-to-GDP ratio. A bigger GDP boosts tax revenue without hiking rates, as businesses and workers thrive. The CBO says growth expands the tax base, easing deficits (CBO, 2024). Arizona’s tech boom shows how growth fills public coffers. No greater example exists than the Intel and Taiwan Semiconductor plants in Phoenix, and their resulting spin-off industries. TSMC’s $165 billion investment is driving commercial and industrial growth in the greater Phoenix area (Phoenix Business Journal, 2025)
A larger economy can make debt seem smaller in relative terms. Growth can drive confidence, spurring revenue (Peterson Foundation). To put this in perspective coming out of WW-II, the growth of the U.S, economy slashed the debt-to-GDP ratio from 106% in 1946 to 23% by 1974. In addition, growth also curbs interest costs—critical with CBO’s $881 billion 2024 servicing estimate.
However, growth isn’t a cure-all. The Tax Foundation warns high debt can choke investment, slowing gains (Tax Foundation, 2022). Debt-fueled growth risks bigger liabilities, as we have seen form the period of 2020 till now.
In summary. growth helps by boosting revenue and shrinking debt’s relative size, but without fiscal discipline, it’s the same old story, kick the can down the road. Not good.
We thank you all for taking the time and reading “Market Watch.” It is meant as an educational piece on the always evolving markets. It is something we plan on providing every month, and your feedback is very important to us.
Richard Mundinger, CFA
Ashlyn Tucker, M. Fin, Analyst, passed CFA Level III exam
Leave a Reply